|
|
Blackjack Streaks
 How
long are streaks? How
long are streaks?
Very little space will be spent on streak data as it has little
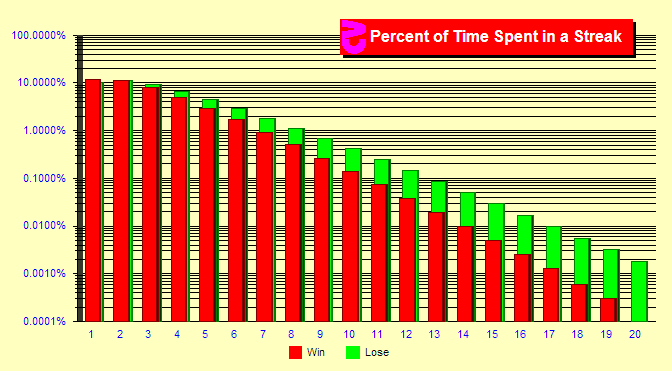
purpose. This chart is a bit unusual. Here the percentage of time
spent in streaks is plotted. Pushes are ignored. In the first column,
you see the percent of time that you are in a streak of one loss
or one win. About 10% of the time you are in a losing streak of
one hand. That is, you lost the hand but won the hands before and
after. The scale is logarithmic. The fourth red bar indicates that
5% of the time is spent in a winning streak of four hands. The sum
of all bars is a tiny bit below 100%.
|
 Does
winning a hand change chances of winning the next? Does
winning a hand change chances of winning the next?
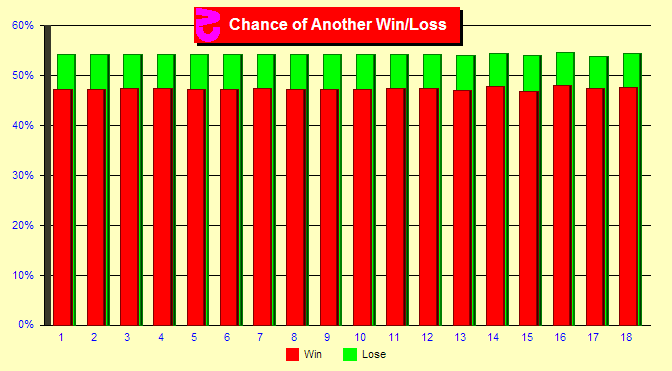
This chart is quite useless. But it displays a simple concept misunderstood
by many. The first column indicates the likelihood that a hand will
be won or lost after one previous hand has been won or lost. The
18th column indicates the probability that a hand will be won or
lost after 18 previous consecutive hands have been won or lost.
The point of the chart is to show that the previous hands have little
to do with winning or losing the next hand.
It is true that in single-deck, if you do not shuffle between two
hands, then there is a small increase in advantage after losing
a hand. This is discussed in Peter Griffin's The Theory of Blackjack.
|
Sim details
- Six decks, S17, DAS, LS, 1 player, Basic Strategy
- Ten billion rounds each
|
|
|