|
|
Chapter 4. Data by Penetration (SCORE Charts)
| Depth refers to a specific point in the shoe. Penetration refers
to all depths up to that point. The card counting books all tell us
that penetration is important. But most counters do not fully realize
how much penetration interacts with everything we do at a Blackjack
table. This chapter contains many charts used to explore these interactions. "It was with difficulty that he was induced to
stoop from speculation to practice." — Thomas Macaulay, 1837
| |
 How
much does penetration matter? How
much does penetration matter?
Penetration is the percentage of cards dealt before the dealer
shuffles. In Blackjack shoe games the dealer usually deals to a
cut card. In single-deck games, the dealer often deals a fixed number
of rounds depending on the number of players. In all cases, the
deeper the penetration the better for the card counter as more information
is known and a better range of counts is available. These charts
are different from the previous charts as they display overall results
depending on the overall penetration. That is, they do not show
the advantage at a particular depth, but the overall advantage of
all hands when the dealer deals to a specific penetration. On the
x-axis you will see numbers from 130 to 26. This means that 130
to 26 cards are behind the cut card. 26 indicates that the penetration
is 5.5 out of 6 decks. The last card dealt in this case would actually
be past the cut card since the shuffle occurs at the end of a round.
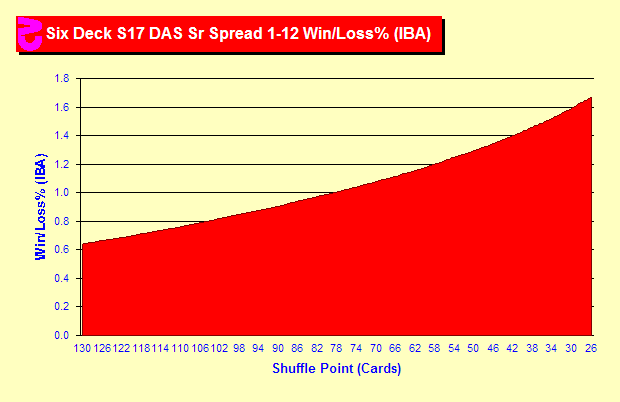
This chart displays the player advantage for 130 to 26 cards cut
off for a six-deck game using Hi-Lo and bets from 1 to 12 units.
We can see that the advantage at 130 cards (2.5 decks cut off) is
about .64% and this increases gradually to 1.67% at 26 cards.
|
 What
is the real gain? What
is the real gain?
But advantage is only part of the story. As overall advantage increases,
it is possible to increase our betting unit while maintaining the
same risk. That is, if our overall advantage increases, we can bet
more at each count even though the advantage at each count is about
the same. The following charts will use SCORE instead of advantage.
SCORE is a method of measurement that takes into account optimal
betting and risk in addition to advantage. For an in-depth description,
see Blackjack Attack by Don Schlesinger. For the purposes
of this discussion, SCORE directly relates to your hourly win rate.
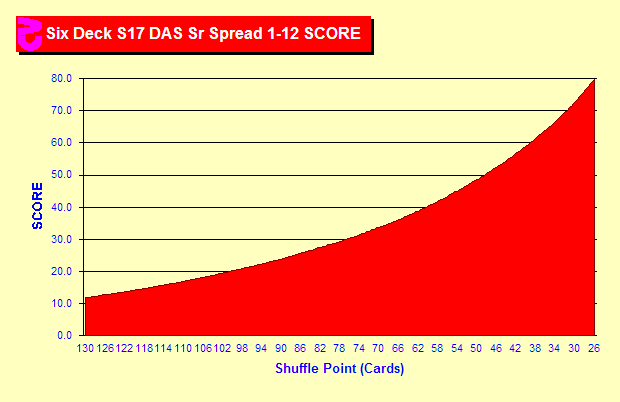
The chart at the right shows the SCORE for the same game as the
previous chart. That is, how much we can expect to win at each penetration.
You can see that the curve in this chart is much more dramatic.
The win rate with .5 decks cut off is seven times the win rate with
2.5 decks cut off. At deep penetrations, a single card of extra
penetration can make a significant difference.
|
|
 What
about unbalanced counts? What
about unbalanced counts?
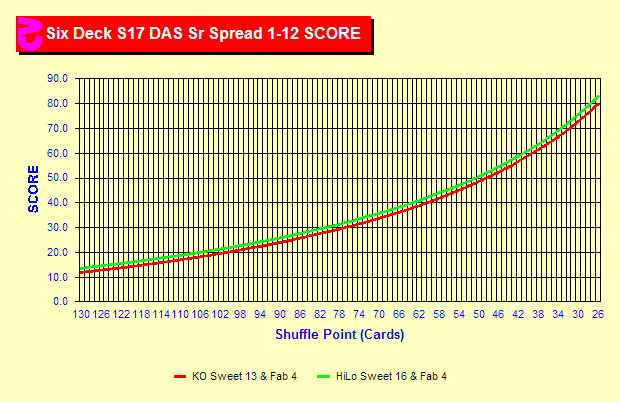
Let us take a quick look at an unbalanced strategy against a balanced
strategy. Here KO and Hi-Lo are compared. Hi-Lo has a slightly better
SCORE than KO here primarily because it was simmed with more indexes.
But the point of the chart is that the performance of unbalanced
(i.e. KO) and balanced strategies (i.e. Hi-Lo) have very similar
patterns even though the previous pages showed that their counts
and advantages at different depths act very differently. These strategies
work somewhat differently — but in the long run they perform
very closely indeed.
|
|
Sim details
- Six decks, S17, DAS, LS, Heads-Up, Hi-Lo, truncate, half-deck
resolution, penetrations from 26-130 cards cutoff by the card,
optimal betting
- Six decks, S17, DAS, LS, Heads-Up, KO-P, penetrations from 26-130
cards cutoff by the card, optimal betting
- Two billion rounds each
|
|
|
 How
much does penetration matter?
 What
is the real gain?
 What
about unbalanced counts?