|  |  Martingale Long Term vs. Short Term
         
          |  What 
              does a Martingale session look like?
These charts are much like the set of charts on long 
              term vs. short term, except they are for a Martingale player. 
              That is, a player that doubles the bet after a loss and drops to 
              the minimum bet after a win. All bets are even money for simplicity. There are four charts on this page displaying results starting 
              with the short term (100 hands) and moving through successively 
              longer terms (up to a million hands). We start with a chart displaying 
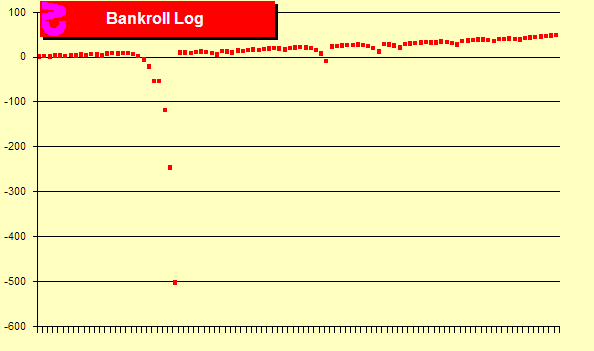
              the total won or lost for a Martingale player playing 100 hands. 
              What we see is tiny increases  so tiny they barely show up 
              on the chart. Then we see a large decrease to a total loss of 500 
              units caused by a long losing streak where the bet kept doubling. 
              Then a win brought us back to the previous high point plus one unit. |   
          |  
 
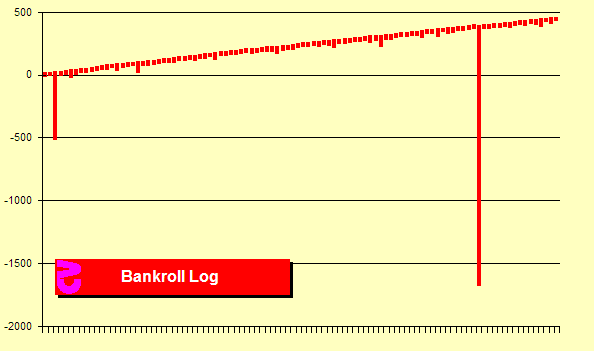
 Now we move to 1,000 hands in groups of 10. Here we see the 500 
              unit negative swing we saw in the previous chart. After that, we 
              have been fairly lucky without any serious losing streaks for about 
              8,000 hands. Again we see a large downswing  in this case 
              to -1,700 units, followed by a recovery.
 |   
          |  
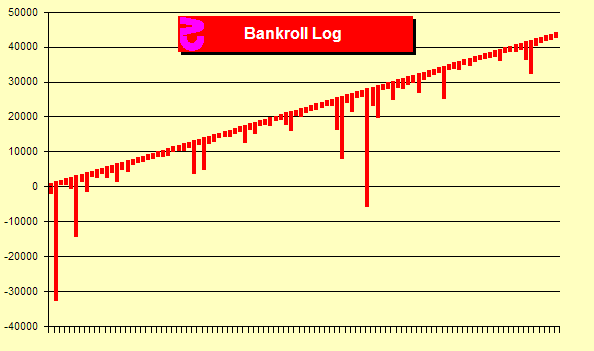
 Let's expand this to 100,000 hands in groups of 1,000. We see the 
              y-axis has expanded as our results in this section range from 40,000 
              units behind to 50,000 units ahead. The line is starting to look 
              smoother. But we see more serious swings.
 
 |   
          |  
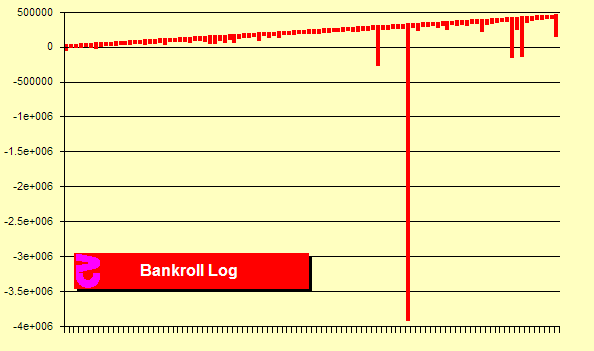
 Finally, 1,000,000 hands in groups of 10,000. Here we start at 
              zero units won and end up with nearly 500,000 units won. However, 
              we had one loss of nearly $4,000,000 requiring a $4,000,000 bet 
              to win it back. That is a bet spread of 1:4,000,000. And that assumes 
              we have a $1 minimum bet. That would be a $100,000,000 loss betting 
              green. Of course this is just one run. Other runs will see the swings 
              at different points and of different sizes. There is no assurance 
              that any size bankroll is large enough to withstand a losing streak. 
              Also, the house edge is still the same as flat betting. At any specific 
              number of hands, the average expected loss will be the house edge 
              times the number of bets.   |   
          | 
 Sim details
              Six decks, S17, 4.8/6 penetration, 4 players, Basic Strategy, 
                No doubles or splits, 1:1 payoutsOne million rounds |  |  |