|
|
Positive/Negative Count Frequencies
 Do
we spend more time in positive or negative counts? Do
we spend more time in positive or negative counts?
This is not a particularly useful page — but the question
comes up now and again and the answer is more complex than might
be supposed. It feels as though the true count spends more time
in negative territory than positive territory. Is this true? First,
if you floor counts, this is clearly true as you always integerize
the count downward. But suppose you truncate, which would round
positive counts down and negative counts up? And suppose you calculate
the remaining cards in the shoe exactly and don't use a cut-card,
removing effects of estimation and the cut-card effect (discussed
in a later chapter)?
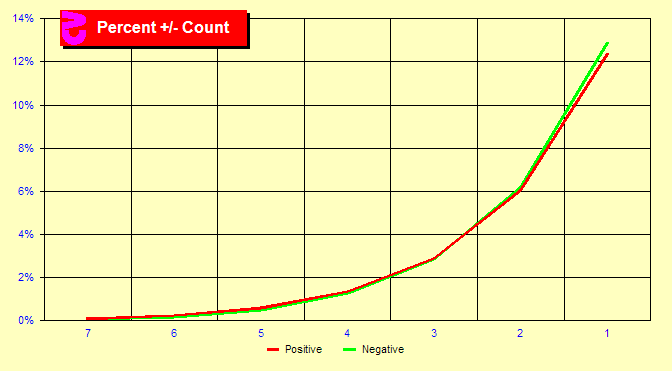
The chart at the right is like the earlier True Count Frequencies
chart, except that it has been folded in half to better compare
the positive and negative counts. The red line shows the positive
true counts for counts with magnitudes of 1 through 7, and the green
line shows the negative counts for the same magnitudes. What we
see in this chart is a greater number of -1 then +1 counts.
|
|
 What
are the percentages? What
are the percentages?
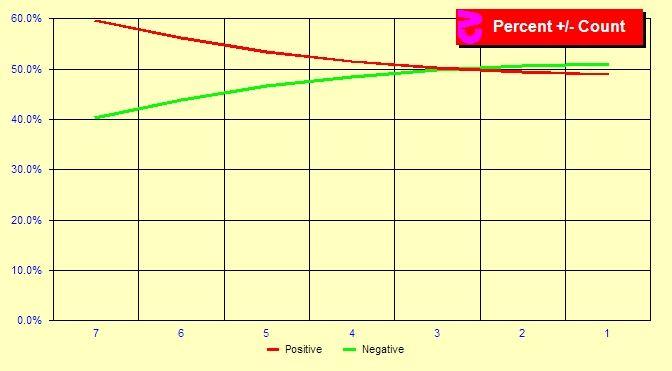
It is difficult to see the differences in larger magnitude counts
in the first chart. To get a better look at these counts, let us
take the exact same data but create a percentage chart. In this
chart, we see that 60% of true counts of magnitude 7 are positive
and 40% negative. Substantially more high positive counts exist
than low negative counts of the same magnitude. But then, few counts
of that large a magnitude occur at all. On the other hand, somewhat
more counts of -1 and -2 occur than +1 and +2.
|
|
 What
does it all mean? What
does it all mean?
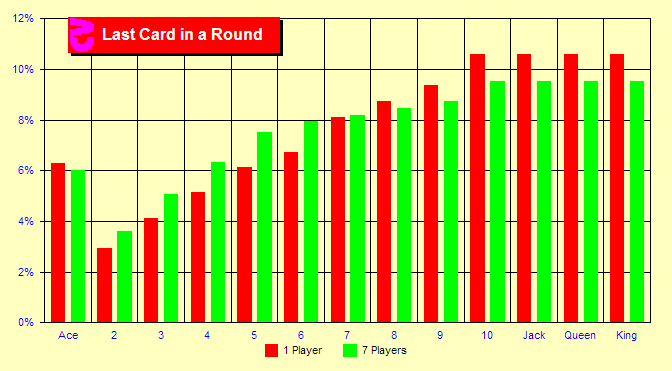
Why is this? In this chart, we will look at the frequencies of
the last card dealt in a round assuming one and seven players. What
we see is that the last card dealt is more likely to be a high card
than a low card. This is not surprising as a ten is more likely
to cause a bust or final hand, but a deuce is likely to call for
another draw. The number of players affects these percentages because
the dealer follows different rules than a Basic Strategy player.
Since the most common count is zero, and the most common last card
dealt in a round is high, more -1 counts exist than +1 counts at
the start of a round. On the other hand, when a round contains small
cards, it often contains many small cards as small cards can result
in hands with many cards. This is why more counts of +7 exist than
-7.
The True Count Theorem tells us that at the end of every round,
on average the true count will be zero. Does this violate the TC
Theorem? No. Because although the number of rounds starting with
a negative count is greater than the number of rounds starting with
a positive count, the average count is still zero. The excess negatives
at -1 and -2 balance the excess positives at +3 and higher. The
TC Theorem does not say that the distribution of negative
and positive counts is the same.
|
|
Sim details
- Six decks, S17, DAS, LS, fixed rounds, Hi-Lo max indexes, trunc,
exact cards
- One and seven players
- Two billion rounds each
| |
|
|
 Do
we spend more time in positive or negative counts?
 What
are the percentages?
 What
does it all mean?