|
|
Card Counting Index Generation
 Where
do indexes come from? Where
do indexes come from?
Indexes are used to make better playing decisions based on the
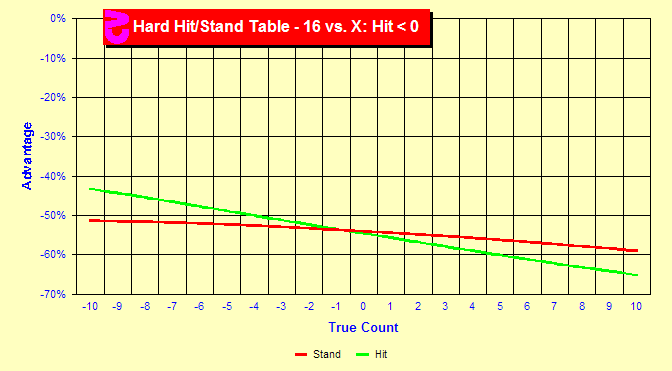
count. This chart displays the data used to generate the 16 vs.
ten index. The red line shows your advantage if you stand and the
green line is the advantage by count if you hit. Your advantage
is terrible either way and gets worse the higher the count. The
higher the count, the higher the proportion of tens are left. The
more tens, the more likely that you will bust if you hit and the
more likely the dealer will have a 20. So, you're pretty much screwed.
However, we can see that hitting becomes a worse decision more quickly
than standing as the count increases. So, we hit on low counts and
stand on high counts for the best possible result. The point at
which the lines cross is the index.
|
|
 How
about reverse indexes? How
about reverse indexes?
Some indexes are the reverse of what we would normally expect. Normally
the higher the count the more likely we are to split. However, some
defensive splits act in the opposite manner. Normally you split to
double your bet and win more. A defensive split is when you split
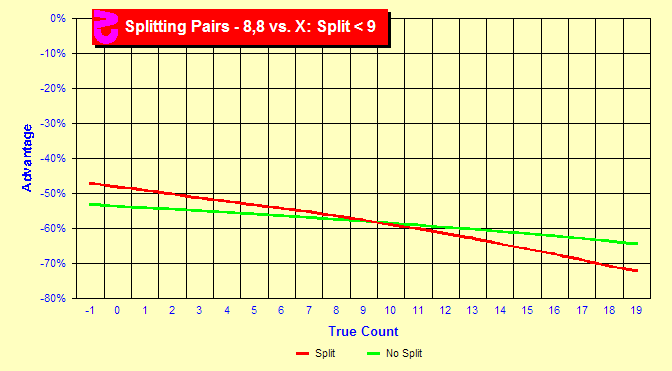
a terrible hand hoping for a push. 8,8 vs. Ten is such a hand. You
have a 16 vs. Ten which as we saw above is a bad hand. (As if we needed
a chart to know this.) Breaking it up we have two hands of 8 vs. Ten.
These are bad hands, but not as bad. As we can see from the chart
splitting is normally the lesser of two evils. But, when the count
gets very high; splitting is worse because you will probably end up
with two 18s against a 20. However, most people these days do not
bother with this index as the count rarely reaches that height. |
|
 How
do rules affect indexes? How
do rules affect indexes?
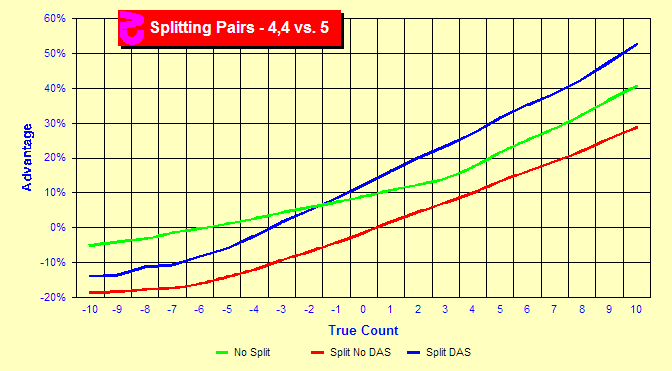
This chart provides an example of an index affected by rule change.
Normally we do not split 4's against a dealer 5. But with the Double
After Split rule, we do. The green line is the advantage with no
splitting. As the count increases, the green line slopes upward
giving us a very nice advantage at higher counts where the dealer
will probably bust. The red line displays advantages for splitting
the 4's with no DAS. This line also increases as the count rises.
But it does not rise quickly enough to cross the green line. So,
we never split. On the other hand the blue line adds the extra advantage
due to the possibility of doubling after a split. The blue line
does cross the green line indicating that the split is advantageous
above the cross point.
Many more index charts can be found at Card
Counting Index Charts.
|
|
Sim details
- Six decks, S17, DAS, LS, 4.81/6, Hi-Lo, flooring, half-deck
- Two decks, S17, DAS, LS, 1.6/2, Hi-Lo, flooring, quarter-deck
| |
|
|
 Where
do indexes come from?
 How
about reverse indexes?
 How
do rules affect indexes?