|
|
Card Counting Goals
 What
is the probability that I will achieve goals? What
is the probability that I will achieve goals?
Let's turn this around and look at the probabilities of success
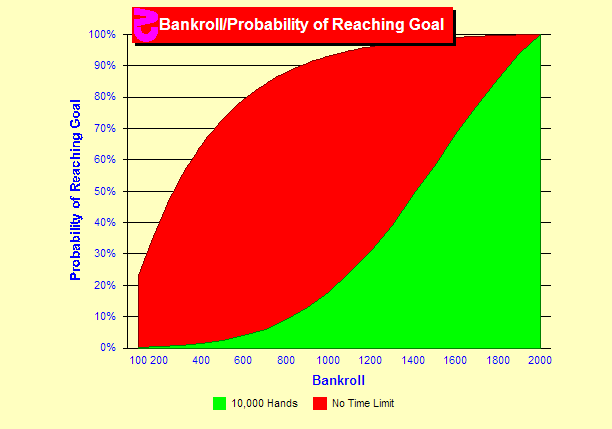
rather than failure. First we will set a goal. In this chart the
goal is 2,000 units. The rules, strategy and amounts bet are fixed
in all sims on this page and are stated in the Sim Details at the
bottom of the page. We now will look at bankrolls from 100 to 2,000
units and plot the probability that we will make this goal. Two
curves are provided. The red curve displays the probabilities with
no limit on the number of hands. That is we will play until we make
our goal or lose our entire bankroll. Obviously if we start at 2,000
units, we have a 100% chance of success since our goal is also 2,000
units. The probability of success rises quickly with larger bankrolls
reaching a 50% chance of reaching 2,000 units with a 300 unit bankroll.
The green line is plotted with a time limit in mind. Here we play
until we hit our goal, lose our bankroll or play 10,000 hands. The
curve is very different indicating that we run out of time often
with smaller bankrolls. Even with a bankroll of 1,900 units, we
will not hit 2,000 in 10,000 hands about 5% of the time.
|
 How
many hands will it take? How
many hands will it take?
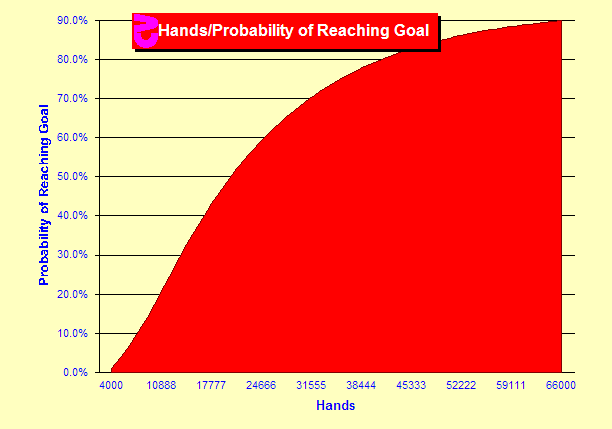
So how many hands must we play? In this chart we still have a goal
of 2,000 units, but we fix the bankroll at 1,000 units and look
at the probability of reaching the goal at various numbers of hands.
At 4,000 hands we have a tiny chance. At 10,000 hands we have a
20% chance of doubling our bankroll, which matches the above chart.
The probabilities grow quickly as the time increases and starts
leveling off above 30,000 hands. We reach a 90% chance at 66,000
hands.
|
|
 What
happens when I include a goal and hands? What
happens when I include a goal and hands?
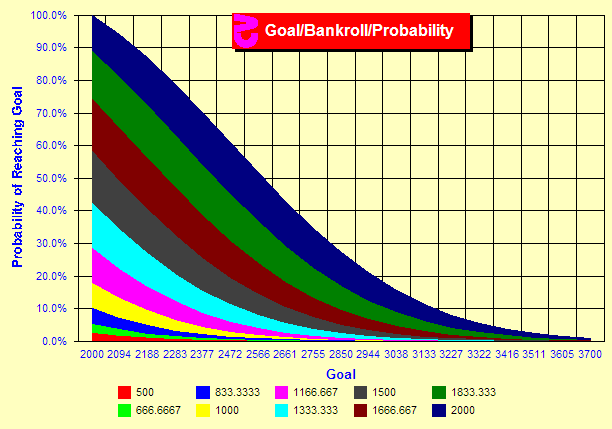
Let's try varying both the bankroll and the goal. The time limit
is fixed at 10,000 hands in this chart. First we will look at a
bankroll of 2,000 units. That is the top of the deep blue area in
the upper part of this chart. The x-axis is the goal and it is varied
from 2,000 to 3,700 units. At the upper left, we see the point for
the goal and bankroll both at 2,000 units. Clearly this is a 100%
probability. The deep blue line swoops downward in probability as
we increase the goal. At the bottom right we see a near zero probability
of reaching a goal of 3,700 units in 10,000 hands with the betting
levels in these sims.
The different colors display the probabilities given different
bankrolls displayed at the bottom of the chart.
Keep in mind that these are just sample charts. Obviously the charts
will change dramatically with different games, strategies, bet spreads,
time limits, bankrolls and goals. The calculators at Card-Counting.com
can be used to calculate new numbers.
|
|
Sim details
- Six decks, S17, DAS, LS, 4.8/6 penetration, 4 players, Hi-Lo,
truncate, full indexes, half-deck resolution
- Five billion rounds each, all sims use a fixed betting schedule
of 1 to 15 units.
|
|
|
 What
is the probability that I will achieve goals?
 How
many hands will it take?
 What
happens when I include a goal and hands?